Strategic Risk Layering in Accumulators: Variance Curves from Football to Basketball
Written by Jakob Lang · Aug 5, 2026
Strategic Risk Layering in Accumulators: Variance Curves from Football to Basketball
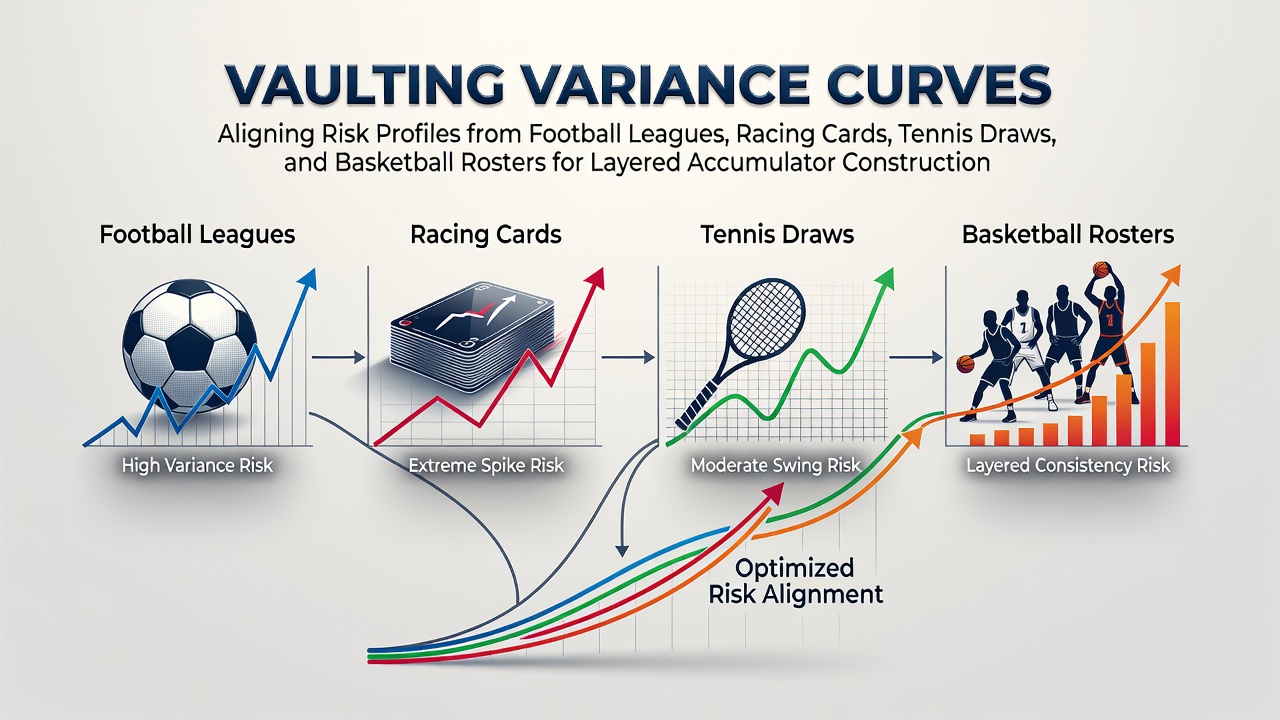
Analysts track variance curves as a method to quantify outcome fluctuations in different sports, and these measurements help shape layered accumulator structures that combine selections from football leagues, racing cards, tennis draws, and basketball rosters. Data compiled across multiple seasons shows football matches often display moderate variance tied to league position and home advantage patterns, while racing cards introduce higher volatility through individual race dynamics and trainer statistics.
Defining Variance Curves in Sports Contexts
Researchers calculate variance curves by measuring the standard deviation of results within each sport category, and this approach reveals how outcomes cluster around expected probabilities. Football leagues contribute baseline variance through consistent team performances across fixtures, whereas tennis draws add layers through bracket-specific upsets that shift rapidly during tournaments. Observers note that basketball rosters influence variance via player availability and rotation changes, which create distinct risk bands compared to the more static elements in racing form guides.
Football Leagues and Their Contribution to Risk Bands
Premier League and Championship data sets indicate variance levels remain steady during mid-season periods, yet August fixtures often show elevated swings because of squad adjustments and fixture congestion. Studies from academic institutions highlight how these patterns allow constructors to place football selections at the lower-risk base of accumulator layers, which then support higher-variance elements from other sports. Figures from European league archives demonstrate that goal distributions follow predictable curves once adjusted for team strength metrics.
Racing Cards Introduce Elevated Volatility
Form analysts examine racing cards by plotting each runner's historical deviation from expected finishing positions, and this produces curves that sit above football benchmarks in most cases. August 2026 meetings at major tracks feature fields where pace and ground preferences create wider result spreads, which constructors incorporate as mid-layer components to increase overall accumulator payout potential without exceeding targeted risk thresholds. Industry reports from bodies such as the New Jersey Division of Gaming Enforcement track these fluctuations across jurisdictions and confirm consistent variance signatures tied to distance and class.
Those who model accumulators find that inserting racing selections between football and tennis layers balances the composite variance curve, since racing volatility offsets the steadier football base while remaining below tennis draw extremes.
Tennis Draws and Bracket-Driven Shifts
Tournament draws generate variance through early-round mismatches and surface transitions, with data from grand slam archives showing standard deviations that exceed most team sports by measurable margins. Constructors align these profiles by positioning tennis selections in the upper accumulator layers where higher risk tolerance applies, and August hard-court swings in 2026 illustrate how draw position correlates with upset frequency. Metrics collected by the International Tennis Federation confirm serve and return consistency ratings produce reliable inputs for curve calculations across multiple surfaces.

Basketball Rosters Complete the Layer Stack
Roster composition data from professional leagues reveals variance spikes linked to back-to-back schedules and injury reports, patterns that constructors map onto the uppermost accumulator tiers. August 2026 preseason and early regular-season games display pronounced roster variance because lineups remain fluid, which provides final risk calibration points once football, racing, and tennis selections are fixed. Performance databases indicate that player efficiency ratings translate directly into curve adjustments that keep overall accumulator volatility within predefined bands.
Practical Construction Steps for Aligned Layers
Constructors begin by selecting football fixtures with the narrowest variance bands to establish the foundation, then overlay racing card entries whose curves extend the acceptable range without breaching it. Tennis draw positions follow as the next stratum because their volatility fits neatly above the racing layer, and basketball roster choices cap the structure by supplying the final variance increment. Software tools that plot these curves in real time allow adjustments during August 2026 tournament windows when multiple sports overlap on the calendar.
Monitoring Curve Stability Across Seasons
Longitudinal data sets demonstrate that variance curves remain stable when measured over rolling 12-month windows, although August transitions between seasons introduce temporary distortions that require recalibration. League archives and racing form books supply the raw inputs, while tennis and basketball statistical repositories supply the cross-checks that confirm alignment accuracy. Constructors who update curves weekly maintain accumulator structures whose realized outcomes track projected risk bands more closely than unaligned selections.
Conclusion
Variance curve alignment supplies a systematic framework for building layered accumulators that draw selections from football leagues, racing cards, tennis draws, and basketball rosters. August 2026 fixtures continue to supply fresh data points that refine these models, and the resulting structures deliver payout distributions that reflect the combined risk profiles rather than isolated sport characteristics. Continued collection of outcome statistics across all four domains supports ongoing refinement of the curves themselves.